Tampilkan postingan dengan label strategies. Tampilkan semua postingan

Kamis, 19 Mei 2016

CCI and Momentum Intraday Trading ~ forex market hours good friday


CCI and Momentum trading is an intraday system will shortly explain all the indicators we will be using. Time Frame 15 min or 30 min. Currency pairs: majors.
Momentum
The Momentum indicator is a speed of movement (or rate of change) indicator, that is designed to
identify the speed (or strength) of a price movement. In other words you should be buying when the price is picking up momentum and selling when that momentum has been lost.
We use Momentum with period 60, computed from typical price. The rule is that we go long only if the Momentum is higher than 100, and go short if Momentum is lower than 100.
Commodity Chanel Index – CCI
The Commodity Channel Index indicator is based on an observation that the market moves in cyclical movements which means high and low of the price are coming in periodic intervals and in
consecutive fashion. So, if we can detect those cycles we can detect the beginning and the ending
of the trend. CCI is used to help identify price reversals, price extremes and trend strength.
We use CCI with period 60, computed from typical price.
Entering the trade
As I said earlier, our trading time is 5:30am GMT time. You should get to the computer about 5
minutes before 5:30 and wait until the candle finishes.
For indicator values, you should check the chart at a close of 5:15am candle at 5:30am.
I use Alpari UK broker, so 5:30am GMT is 7:30am in broker time that you see on the charts.
LONG signal
We will go LONG (buy) if and only if ALL the following conditions are met:
1. Momentum(60) of the 5:15am candle is higher than 100 AND lower than 100,8 (in other
words between 100 and 100,8)
2. CCI(60) of the 5:15am candle is higher than 0
Then we will buy at Market price.
CCI and Momentum Intraday Trading


We can see that Momentum is above 100 (but below 100,8) and CCI is also above 0, so we enter
Long by Market price.

SHORT signal
We will go SHORT (sell) if and only if ALL the following conditions are met:
1. Momentum(60) of the 5:15am candle is lower than 100 AND higher than 99,2 (in other
words between 99,2 and 100)
2. CCI (60) of the 5:15am candle is lower than 0
Then we will sell at Market price.
Example

We can see that Momentum is below 100 (but above 99,2) and CCI is also below 0, so we enter Short
by Market price.
NO TRADE
We will NOT TRADE for the day if some of the conditions are not met.
For example Momentum >100, but CCI < 0; or if Momentum > 100,8
Example
At 22 July 2010, you can see that the conditions to enter either long or short were not filled.
Momentum is below 100, but CCI is above 0.
We will always use fixed Profit Target 40 pips and fixed Stop Loss 40 pips. After we enter the trade,
we don’t manage it; we simply wait until it hits profit or loss. You can leave the computer and check
the result in the evening or next morning.
ALWAYS DOUBLECHECK that you have set your Stop Loss and Profit Target properly before leaving the computer!

Money Management
Rule1
Always use Stop Loss.
Stop Loss (SL) is an order that will tell the system to cancel the trade at the given loss, if the market is going against us. This way it protects us by keeping our loses defined and small. Trading without SL or moving SL will eventually lead to account wipeout.
If the market is going against us, we should simply accept the small loss and quit the trade. All trading systems are based on probability or some edge. There is no system that will only win. Losses are a part of the trading, and what matters is the positive result at the end of the month or year, not today’s loss.
Stop Loss of 40 pips, so you will never lose more than 40 pips on one trade.

The general rule for any system is to NOT risk more than 2 % of your trading account on one trade.
This means that if you have account with $2,000 capital, you should risk maximum 2% of it on one
trade, which is $40.
Because our Stop Loss is always 40 pips, you can trade Forex Morning Trade with 0.1 standard lot
(which is 1 minilot, and 1 pip is $1).
If you have account with $ 10,000 capital, your 2 % risk is $200. Because our Stop Loss is always 40 pips, you can compute the lots size using the formula: Minilots = (risked amount) / (SL in pips).
In our case: $200/40 pips = 5 minilots (which is 0.5 standard lots and 1 pip equals to $5)
So, with $10,000 capital and trading 0.5 lots, if Forex Morning Trade System wins, you’ll earn $200, if it loses, you lose $200.
A good rule to remember: if I use 0.1 lot, then 1 pip = $1. If I use 0.2 lots, then 1 pip = $2 and so on.


More info for CCI and Momentum Intraday Trading ~ forex market hours good friday:
Read More..

Sabtu, 07 Mei 2016

RSI Stochastic with Bollinger Bands ~ forex market hours gmt.mq4


The two indicators I will be using are Bollinger Bands and stochastic relative strength index (StochR SI ). StochRSI , which combines the features of stochastics and RSI , was
detailed in Tushar S. Chande and Stanley Kroll’s book, The New Technical Trader. I selected this combination because it is a useful way to determine when prices will stop tagging a Bollinger Band and are likely to move all the way from one band to the next. Of course, those prices may not move all the way, so you will need to use stops for protection. You will also want to use a simple money management strategy of allocating only a portion of your capital to any one position.
First, let’s take a look at R SI and StochRSI . Stochastics, you will recall, is simply a way of measuring, for a given period of time, where today’s close is relative to the lowest low, and where within the range of the highest high and lowest low the price falls over the same time period. The formula for stochastics for a 14-day period is:
Todaysclose– Lowestlowofthelast14 days/
Highesthighofthelast14 days– Lowestlowofthelast14 days

Note the use of range — high minus low — in the denominator of the calculation.
Many trading techniques and strategies are built around range in some form, and if you use several indicators, you want independent sources, so that the indicators independently confirm one another.
Independent confirmation is one part of Dow theory you should consider embracing. For example, Larry Williams’ %R is the reverse of stochastics, substituting the difference of highest high
over a given period minus today’s close for the numerator. So if you want to use this indicator together with stochastics, you are not using independent indicators.
Instead, you should consider using an indicator that does not involve a range, such as volume, or one that is statistical in nature, such as Bollinger Bands.
The next step is to identify the type of stock that will work best. If you are going to use an indicator that relies on price volatility such as StochR SI , then you should examine your charts to see the
nature of the current volatility. For example, I have used AOL Time Warner (AOL ) in Figure 1. What differentiates the four areas (A, B, C, and D) is the combination of price and volume
volatility. Area A has low price and high volume volatility. Area B has both high price and volume volatility. Area C has high price volatility, and low volume volatility for the stock.
Finally, area D has moderate volume and price volatility. A useful rule to remember is that a price is “in gear” — that is, in sync — if price goes up on high volume or down on lowered volume. Prices that reflect such moves are prices that the market is comfortable with. If you were long in area A or

short in area D, you would have done well. A trading system designed for areas A and D — “ingear” moves — is likely to have a terrible time in areas B and C. As you will discover shortly, AOL represents the good, the bad, the ugly, and the really ugly when it comes to using a trading system that only takes long positions.
Stochastic RSI Trading System
IGURE 1: DAILY AO L PRICE AND VO LUME. Price volatility is less before June 1998. For indicators that use price volatility such as StochRSI, you want to use fewer periods in the calculation to generate trading signals than you would prior to June 1998.
Stochastic RSI VS RSI
RSI VS . STOCH RSI If you compare RSI and StochRSI measurements over a few months, you
will notice a difference: One of them will hit the extreme faster and tend to stay near the extreme better than the other. The formula for StochRSI for a 14-day period is:
RSI– LowestRSIoverthelast14 days/
HighestRSIoverthelast14 days– LowestRSIoverthelast14 days

If you build this indicator, of course, you can make the RSI use a 14-day period or you can, for example, make the RSI based on a nine day period and retain the 14 days for the stochastics portion. As you can see from Figure 2, StochRSI does a better job of hitting its extreme and staying there than R SI does. StochR SI allows you to draw a line that acts as a threshold line better than RSI (black lines drawn within green boxes). While bothRSI and StochRSI range between zero and one — although cosmetic adjustments are made to RSI so it appears to range between zero and 100 — StochRSI hits its extreme faster because you are only looking at the RSI over a recent lookback period. Still, there are times, as in April, when StochRSI gives you a mixed message.
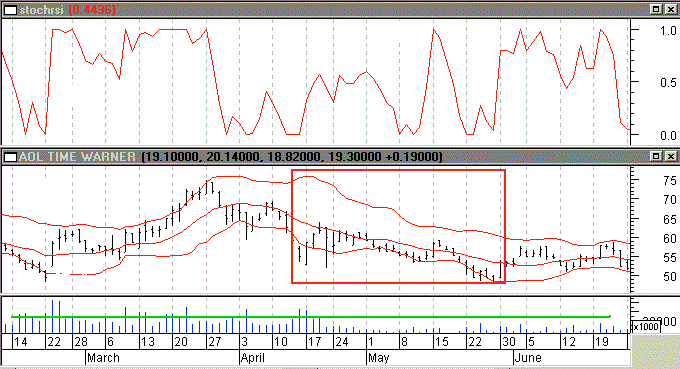
This is where Bollinger Bands can help. If you overlay price with Bollinger Bands, as in Figure 3, you begin to get an idea of the setup for a long position:
Act when prices are tagging the lower band (point A) with a move up (point B), while StochRSI shows a significant gain in value (point C). However, this setup has potential problems for long trades; look at the red box in the chart. In April and May 2000, you have examples of prices tagging the lower band and then closing above. In one instance (event D), StochR SI would potentially give a confirming signal that you should go long, but then prices go back down to the lower band. This is an example of the problem I referred to earlier, that low volume is often
Stochastic RSI VS RSI
FIGURE 2: DAILY AO L PRICE AND VO LUME 2000 WITH RSI (TOP CHART) AND STOCHRSI (SECOND FROM TOP CHART). StochRSI not only responds quickly to price changes, but also hits its extreme and stays there better than RSI (see green boxes); 14-day periods are used for both RSI and StochRSI.


accompanied by randomness. Note that volume in late April and May is significantly lower than in the preceding time frame. I will try to incorporate some rules into the trading system to account for this, but in such a situation it is often best to exit and find another stock.
I will now execute a trading system, without stops and money management, to see what it can do. The trading system is going to have the following trading rules for a long position:
Stochastic RSI Trading
FIGURE 3: DAILY AOL AND VOLUME AND STOCHRSI (UPPER CHART): FEBRUARY/JUNE 2000. A 20-day, two standard deviation Bollinger Band is overlaid on the price chart. On the left hand side is a setup that promises to enter a long position. It starts with prices tagging the lower band, event A. Prices close above the lower band, event B, and at the same time StochRSI has moved up to a value of 0.4, event C. What is distressing is the action in the red box, especially in view of event D, a spike in StochRSI and a close above the lower band followed by a retreat of prices. But if you look at volume below, the problem mentioned earlier is obviously apparent: low volume giving you a random price movement.
Entry:
1 Look for prices tagging the lower Bollinger Band
2 Look for a closing price of an up day, that is (close>open), that is above the lower band after having prices follow (1)
3 Volume of this up day should be greater than the volume of the previous up day
4 StochR SI should be above a threshold to ensure some momentum is associated with the push up
5 The (close-open)/(high-low)>0.2, to avoid days that have short candlestick bodies.
Exit:
1 StochR SI should be less than a threshold to assure loss of momentum
2 Look for prices to reach the upper band
3 Closing price should be near the top Bollinger Band.

You are looking for the stock to continue up if it has been tagging a lower Bollinger Band and then made a convincing move up, so that it conforms to entry rules 2 through 5 above. I used weighted closes in calculating the Bollinger Bands:
(2*close+high+low)/4.
From Figure 4 you can see that investing $1,000 in 1997 and using this trading system without stops resulted in $58,000 (second chart from top), which beat buy/ hold by more than $47,000. However, there are serious drawdowns in each of the areas B, C, and D. The only factor that varied in this trading system was the number of periods for StochRSI and Bollinger Bands. When using the initial version of this system I optimized the StochR SI thresholds as well. The equity looked better in terms of drawdowns and ended up with $300,000+, which led me to believe that there might be something to this approach.
Optimizing on everything — from periods to thresholds — results in spectacular equity performance (Figure 5), and although it is curve-fitting, it shows the potential you are trying to
achieve. It also shows the trading system is biased to take advantage of strong
uptrends: During uptrends, prices that tag the bottom Bollinger Band will
FIGURE 4: DAILY AOL AND VOLUME WITH EQUITY PERFORMANCE. Starting with $1,000, a trading system that goes long using Bollinger Bands and StochRSI is seen to have four trading behaviors, as indicated by areas A, B, C, and D. Note the equity scales are X10. The second chart from the top is the equity performance without stops. In area
A, the system makes little money despite rising prices, breaks even in B, has a better performance in C, and then performs poorly during D. Even area C is not especially appealing because you are faced with serious drawdowns, unless you use stops (as seen in top chart). The top chart, using maximum stop-losses of 5%, provides better performance.
move to the upper band, resulting in a trading system that can do much better than buy and hold. But letting thresholds optimize curve-fits the performance too much, so I set the thresholds visually. To get rid of the serious drawdowns, I used maximum loss stops of 5%, which improved the equity performance (Figure 4: top chart). Still, area B just eats away at your equity, although it does appear I took care of the low volume problem in area C.
FIGURE 5: DAILY AOL AND VOLUME WITH EQUITY PERFO RMANCE FOR AREA A. A $1,000 equity investment reaches $45,000+, while buy and hold reaches $20,000+. While this kind of equity performance (top chart) is spectacular, it comes from letting all the variables in the trading system be optimized — curve-fitting. What this shows, however, is the potential of the system if the periods and thresholds are chosen correctly, along with the right (strong uptrend) price movement. It also reflects the bias of the trading system, which takes advantage of the fact that in a strong uptrend, prices that tag the lower Bollinger Band do so only briefly.
Reference :
Stocks and Commodities Developping a Trading System by Dennis Peterson.


More info for RSI Stochastic with Bollinger Bands ~ forex market hours gmt.mq4:
Read More..

Jumat, 06 Mei 2016

Quantum Trading ~ forex market hours gmt mt4 indicator download


Most new trading just doesn’t like to wait for a complete and perfect trade to take place. These types of short term traders would be very happy to get into multiple trades per day for 10+ pips profit for each trade. Rather than opening one trade per day and wait until price hits the 100+ pips target.
Momentum trading or short term system is the best forex trading strategy that they can use. But with the Quantum system we are also going to include medium term or long term trading as well. The reason for that is while short term trading is the favorite strategy for new traders, they won’t be beginners forever! And soon they will feel the need to trade more professionally for larger profits.
And instead of looking for another trading system, you will find long term trading strategy within this system as well as the momentum – short term – strategy.
hort term trading…
Best to be used with 5M , 15M , 30M and 1H time frames.
Trading rules:
When the 24 EMA cross above the 124 SMA, wait until a blue bar is formed above or below the 0 line of the A.O indicator – best if it’s above the 0 line. When that happens, open a BUY Order and set your stop loss at the last support level or 75 pips.
Your exit sign would be a red bar formed above or below the 0 line of the A.O
indicator.

Example:
Quantum trading
The opposite conditions are used for sell orders.
When 124 SMA cross the 24 EMA, wait until a new red bar is formed above or below the A.O indicator. Best if it’s below the 0 line. When that happens, open a sell order and set your stop loss at the last resistance level or 75 pips.
Your exist sign is when a new blue bar is formed above o below the 0 line of the
A.O indicator.
Example:
Quantum trading

Long Term Trading
For long term trading we are going to apply almost the same rules with few changes.
For sell orders, only sell when the red bar is formed below 0 line + 124 MA cross
above 24 MA.
And only exit when a blue bar is formed above the 0 line + 24 MA cross above 124 MA.
Example:
Quantum Trading - momentum strategy
Notice how with this strategy you could get a lot more profits, if you can wait! And for buy orders, only buy when the blue bar is formed above 0 line + 24 MA cross above 124 MA.
And only exit when a red bar is formed below 0 line + 124 MA cross above 24 MA.
Example:
Quantum trading - Momentum Strategy

More info for Quantum Trading ~ forex market hours gmt mt4 indicator download:
Read More..

Selasa, 03 Mei 2016

Forex Scalping Strategies ~ forex market hours us


Whats are the the forex scalping strategies?

Forex Scalping methods are a large number trades within small periods for getting small profits.
The scalping (on the DOM) strategy consists in three simple step:
firstly finding out which way is the tendency;
next start looking the price levels where the current market pauses,
searching within the DOM making your scalping trades.
Position traders maintain their open positions for many hrs or days. The scaping traders to make good use of the leverage that is available in the FX market , stays open for just several hrs, minutes or perhaps seconds. But carry out numerous trades during the day.
Vantage and disavantage of scalping method
The profittability are larger than in position trading.
When stop the trade ignore the market, your tendency and sleep well.
4-6 hours’ scalping causes a impressive emotional stress therefore at the end associated with the trading day one can feel exhausted.
Forex Scalping cant stand errors. A person who wants scalping to do it should be totally cold-
blooded and capable of analyzing the situation immediately. This is a basic difference between scalping and position trader.

Whats is the best leverge?

An amount of leverage (as much as 25 or 60:1) could be appropriate for traders who open and shut positions in extremely swift succession, so long as stop-loss orders will never be ignored.
in the event such as the aftermath of the surprise FED decision, or perhaps an unpredicted non
Farm Payrolls release, propagates can widen instantly the spreads, there might not be lots of time to realize the stop-loss order despite a reliable broker, and the loss could be increased if high leverage were for use. To avoid such final results from materializing, it may be beneficial to reduce the leverage ratio considerably when we aim to trade market occasions that induce gaps within the bid-request spread, and make large unpredictability.

What are the main features of Forex Brokers for scalping?

The broker is the most essential variable for identifying the chance, and profitability of the
scalping technique for any trader A scalper has control of energy over his methods, stop-loss, or take profit time period for buying and selling. But traders can not control the stability of the server forex brokers to which the operation on the market.
Low Spreads are essentialy for scalper scalper which will open and shut tens of positions inside a short time, the price of his trades is a very significant item on his balance sheet.
Let’s see a good example.
A scalper opens and liquidates 30 positions on the day within the GBP/USD pair, for
that the spread is generally 3 pips. Let’s also that his trade dimensions are constant, which 2/3 of his positions are lucrative, with typically 5 pips profit per trade. Let’s also state that the average size his loss is 3 pips per trade.
Whats his gain/loss ?
Positions in profit) – (Positions in loss) = Net profit/loss
(20*5)-(10*3) = 70 pips in total.
Whats his gain/loss with no cost of multiplication incorporated?. Now let’s include the cost of the spreads, and repeat the calculation.
(Positions in profit) – (Positions in loss + Cost of the Spread) = Net profit/loss
(20*5)-(10*3+30*3) = -20 pips in total.
An awful surprise awaits our hypothetical trader in the account. The amount of his lucrative
trades were two times the amount of his losing ones, and the average loss involved half his average
gain. Now lets replicate the identical computation information exercising, by having an additional hypothetical forex broker where the distribute is just 1 pip inside theGBP/USD set, 5 pips for every earn, and three pips for every loss (the identical situation which was examined checked out initiallyin the beginningat) getting ausing just one-pip spread brings us an outcomes of
(20*5)-(10*3+30*1) = 60 pips net as a whole profit on the GBP/USD with 1 pips spread.
Why is there this type of large discrepancy within our results? Even though the amounts do speak for themselves, let’s help remind the readers that although we make money only on the lucrative trades, we pay the forex broker for each position we open, lucrative or otherwise. This is the question.

In summary, we must make certain of decide the broker that using least expensive spread for your currency pair preferred . A scalper must analize the account packages of numerous brokers completely before of open an account and become a client of one of them.
Forex Scalping Strategies


More info for Forex Scalping Strategies ~ forex market hours us:
Read More..

Sabtu, 23 April 2016

Fibonacci basic tutorial ~ forex market hours gadget windows


My experience makes me a believer in the adage that there is a natural order in the markets that has more geometric symmetry than most traders realize or want to believe. This is a fact, not subjective, because almost all market turning points adhere to a certain numerical sequence that you can prove to yourself by looking at historical charts. This sequence applies to both price and time. The primary tool used for this trade analysis is Fibonacci relationships. They include Fibonacci retracements and extensions, as well as time measurement, pivot dates by ratio and numerical sequence.
There is no need to go into the history of Fibonacci, other than to know it is the force that rules the movement of about anything you can imagine, including the financial markets.
The Fibonacci series is a numerical sequence that expands by adding the previous numbers together as shown here:
1, 1, 2, 3, 5, 8, 13, 21, 34, 55, 89, 144, 233, 377, 610, 987, 1597, 2584, 4181, etc.
Fibonacci
The most interesting property of this numerical sequence is that as the series proceeds, any number is 1.618 times the preceding number, and 0.618 of the next number.
Example:
1.618 x 34 = 55 x 1.618 = 89 x 1.618 = 144.
.618 x 55 = 34, .618 x 89 = 55, .618 x 144 = 89.
The .618 and 1.618 numbers are what they call the Golden Numbers. You will also see the sequence root of .618, which is .786, and 1.272, the square root of 1.618, occur frequently in your trading.
Suffice to say, the Golden Numbers are dominant in math, nature and science. Planets revolve around the Golden Number, as does your heartbeat on an EKG, and even the index finger on your hand. Each section of your index finger, from the tip to the base of the wrist, is larger than the preceding one by about the Fibonacci ratio of 1.618. And lastly, they tell us that the Egyptian pyramids are based on the Golden Ratio/Numbers.
Key Point:  My source for all of this trivia is goldennumber.net, but you can just go to Google.com and find any number of sites that give you this background in volume. If you believe it, I can teach you how to use it in a pragmatic way trading and investing in the markets.
Key Point:  In spite of all the financial, economic and geopolitical events that affect the markets, you will see beyond any doubt that the up and down price fluctuations in all major markets are governed by the Fibonacci Golden Ratio.
Fibonacci is a sequence tool that is excellent by itself and that becomes very powerful when combined with volatility bands and standard deviation, let alone any of the other tools.
Fibonacci Retracement
I use the following Fib retracement ratios:
  • .236
  • .382
  • .50
  • .618
  • .786
  • 1.00
The minor ratio that will come into play sometimes is the .707 Fib retracement (square root of .50).

Retracements depict the potential reversal levels, support and resistance.
To calculate a retracement in an uptrend, which is when a stock rallies and then pulls back to some percentage ratio of the previous swing point low, you would do the following:
  • High - Low x Fib Ratio, then subtract it from the High.


  • Calculation of .618RT level    

        60 - 40 = 20 x .618RT = 12.36
        60 - 12.36 = 47.64 (.618RT level)
  • Complete the other ratios for practice.
  • To calculate a retracement in a downtrend, which is when a stock declines and then pulls back to some percentage ratio of the previous swing point high, you would do the following:
    • High - Low x Fib Ratio, then add it to the Low.
    • Calculation of .382 level

          50 - 30 = 20 x .382 = 7.64
          30 + 7.64 = 37.64 (.382RT level)
       
      mplete other ratios for practice
    • fibonacci retracement

    • Fibonacci Extensions
      I use the following Fib extensions ratios:
      • 1.272
      • 1.618
      • 2.00
      • 2.24
      • 2.618
      • 3.14 (Pi -- Key ratio)
      • 4.236 
      These extensions occur after price exceeds the 1.00 level and makes new lows or new highs beyond the last leg.
      A minor extensions ratio that will come into play sometimes is the 1.414.
      To calculate a Fib extension after price exceeds the low or high of the last leg, you would:
      Extension down
      • High - Low x Ratio, then subtract from the High.
      Calculation of 1.272 extension down

          90 - 80 = 10 x 1.272 = 12.72
          90 - 12.72 = 77.28
       Extension Up
      • High - Low x Ratio, then add to Low.
      • Calculation of 1.618 extension up

            90 - 80 = 10 x 1.618 = 16.18
            80 + 16.18 = 96.18

         
      • We have given you some Fibonacci background, and the basics of calculating the retracements and extensions, in addition to the ratios that I suggest you use. Now we will build on that.
        Key Point:  When you look at retracements and extensions in terms of price, you should also look for symmetry of time using the same ratios. It is not mandatory that you have both, but it is much better symmetry when you do, which builds your case for higher probability.
        Key Point:  Once you have identified a high-probability zone, it is the price action at that zone that determines what you will do.
        The following SPX charts will demonstrate retracement, extension, time and price action at different zones.
        Fibonacci tutorial
        Fibonacci Tutorial 
    • This SPX weekly chart frames the Fibonacci retracement levels between the 1553 top and 769 bottom. You can see that the .236RT to 1553 of 954 was a major obstacle. The first rally from 776 reached 965, but didnt close above it.
      From 965, the SPX declined to the 769 bottom (A) and then rallied to 954, right at the .236RT level, but failed to close above 954. The next leg down (BC) made a 789 low, then reversed to the upside and approached the .236RT level for the third time.
      Key Point:  The more price trades at resistance or support, the weaker the line is and the probability of penetration increases.
      Price breaks above 954 and trades to the 1015 level. The 1.272 Fib extension of the BC leg is 999, and for 12 weeks, the SPX traded sideways with a high close of 998.
      Key Point:  If price breaks out of a range at a Fib level, the highest probability is that it will seek the next level.
    • The .382RT to 1553 is 1068, and that is exactly where the SPX traded and went sideways for four weeks (more detail on next chart) before breaking out and trading to the next Fib zone, which is the .50RT to 1553 of 1161. Notice also that there is a confluence with the 2.24 Fib extension of the BC leg at 1159. At the completion of this course on Jan. 29, 2004, 1155 is the rally high on Jan. 27, the SPX had traded down to 1122.38.
      This chart demonstrates the natural order that the SPX has traded just using Fib retracements, extensions and time, which you will see better on the next chart. You have anticipated the key zones in advance.
    • On this chart, we will start with the time symmetry that is present in this move.
    • The BC leg from 954 - 789 was 14 weeks to the low and 13 weeks (Fib number) to the low close. Any reversal bar setup right there had to be taken. The 789 low week was a reversal bar (Hammer) with a high of 841.39. Sequence traders took entry.
      Now it gets more interesting. Once price broke out above 954, you had anticipated the 1.272 zone, but on this chart, you also see that the last low in that zone was week 21 following the 789 low week. 21 is the 1.618 Fib extension of 13. Price then rallied, breaking out of the 1.272 zone range.
      Key Point:  When looking for time symmetry, you can use the low close or low, and measure it with a high close or high. That will all be considered symmetry.
    • After the 1.272 breakout, the SPX traded right up to the .382RT zone at 1088. The first weekly bar in that range was the 34th week, and price went sideways for four to five weeks with a high of 1064. Once again, there was price and time symmetry, as 34 (Fib number) is the 2.618 Fib extension of 13.
      The advance above the .782RT level means anticipation of the next Fib RT zone, which would be the .50RT to 1553 at 1160. There is also a .50RT to the 1530 secondary high of 1150, and then the 2.24 Fib extension of the BC leg at 1159. The 1530 high was the 1,2,3 lower top to the 1553 all-time high after the initial decline to below 1350 from 1553. That would make it a significant high to measure a retracement.
      From a time perspective, the 1155 high is Week 46 and the high close is Week 45. The 3.14 Fib extension of 14 is 44.
      Review these two charts several times so you gain a good idea of the structured way a market trades most of the time and enables you to anticipate high-probability zones where you will take some kind of action, either buy or sell, but it is never nothing.

More info for Fibonacci basic tutorial ~ forex market hours gadget windows:
Read More..

Jumat, 15 April 2016

Forex Strategies ~ forex market hours utc


What are the forex strategies?
A forex strategy is a group of specific rules, that determine buy and sell points for your trade in forex markets. These points, known as signals of trading, are often marked on a graph in real time and will prompt you to pull the trigger.
Here are some of the most common financial technical indicators used to construct the forex strategies:
Chart Patterns: ( Candlesticks formations: doji, Hammer, and more; chart patterns formation: triangle, butterfly, kor harmonics and more).
Moving Averages: ( exponential, simple, smoothed),
Oscillators: Stochastics, Momentum, Relative Strength, Commodity Channel Index,Bollinger Bands, and more other.
These patterns of indicators will be combined in the creation of a rule for un trandi system. For example, the MACD crossover system uses two moving average parameters, the long-term and the short-term, and a signal line to create a rule.
The advantages to adopt a forex strategy?
Help to control of the emotion that as one of the biggest flaws of individual trades. The trading system can increase profits.
The main trading systems in Learn Forex Trading are those that follow trends (a popular saying in the market is "the trend is your friend"), or trading system that buy or sell on breakouts. But they are many forex strategies based other medthod of trading or more methods combined:
Scalping Forex Strategies;
Trend Following Strategies;
Counter Trend;
Trading Strategies based on chart patterns and more.
Add caption
Forex Strategies

More info for Forex Strategies ~ forex market hours utc:
Read More..